The curves below represent the variation of temperature with time when pure and impure samples of a solid were heated separately.
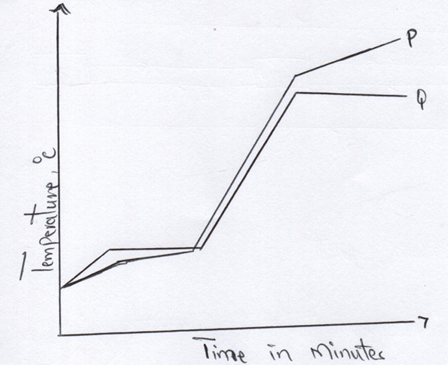
- Which curve shows the variation in temperature for the pure solid? Explain.
- State the effect of impurities on the melting and boiling points of a pure substance.
- Melting points
- Boilling points