The graph below shows a curve obtained when water at 20℃ was heated for 15 mins.
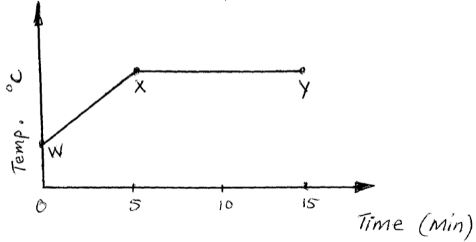
- What happens to the water molecules between points W and X
- In which part of the curve does a change of state occur?
- Explain why the temperature does not rise between points X and Y