The following figure shows velocity –time graph for the journey of a car in 100minutes.
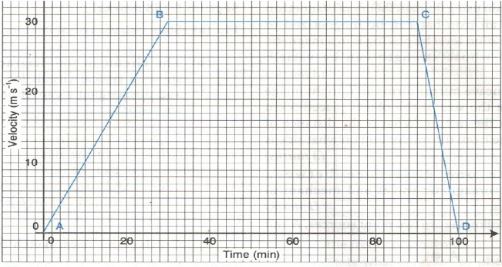
- Determine the acceleration of the car between A and B and between C and D
- Determine the distance covered by the car during the journey
- Determine the average velocity of the car