The graph below shows the effect of injecting one unit of insulin into a person. The concentration of glucose in the blood is measured at regular intervals.
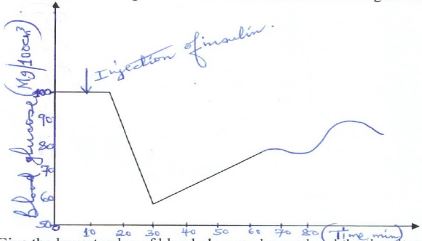
- Give the lowest value of blood glucose observed and the time it was recorded.
- Explain the fall in blood glucose level.
- Name the mechanism that led to the increase in blood glucose level when it had been falling.