The graph below shows the relationship between number of herbivores and carnivores in a park.
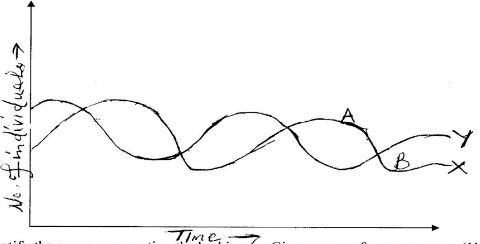
- Identify the curve representing the herbivores. Give a reason for your answer.
- Suggest a reason for the slope of graph x between points A and B.
-
- Name the relationship between the two types of organisms as portrayed by the graph.
- State the significance of the relationship you have stated in (3)(1) above. (
- Describe the long term effect on the parks ecosystem if the species of the carnivores were to become extinct.